In this post I will discuss how to create a simple pie chart using 3 popular libraries: D3, Google charts and Infographic Charts library.
I will be looking at the pros and cons for pie chart created with each library.
We will try to use the libraries such that the end result looks as similar as possible and then compare the code written to get the result.
Note: This tutorial demonstrates how to create a pie chart using JavaScript, which is a client library. It is outside the scope of this tutorial to show how to create dynamic pie charts. To create dynamic charts you would need a server side component like PHP. If that is what you are interested in then I suggest first reading the post about Creating a PHP MySQL pie graph and then coming back to this tutorial.
How to create a simple pie chart with D3
D3 is a quite popular JavaScript library that does much more than charts. It is an MVC framework that has support for DOM manipulation but also for SVG. This makes it quite a nice tool for creating interactive charts. In this post we will only be looking at creating a simple piechart.
Here is the link to download & install D3 and the D3 documentation and examples.
Reasons to use D3 for charts – D3 Pros
- it’s free to download and use as you want and this library is released under BSD license.
- D3 does much more than charts. It is a fully fledged MVC framework and SVG charts are only a side effect for the features it offers
- D3 it is data driven, meaning that it has a lot of features allowing loading and manipulating data that can easily be bound to graphical elements
- charts can be made responsive, but it requires a lot of extra programming
Reasons to not use D3 for charts- D3 Cons
- D3 is a fully fledged MVC framework, so it can be challenging to use it in simple tasks like the pie chart we created here
- It has a relatively steep learning curve due to the wide range of applications and features it has.
- It uses SVG for rendering charts which can slow down the browser
- To create a chart in D3 you actually need to draw each and every element of the chart, as for example I did not find an out-of-the-box pie chart component. So I had to draw arcs and fill them in with colors
- requires advanced JavaScript knowledge to use
Conclusion about making a D3 pie chart: It took me a while to get my head around how D3 works and it takes a while to get used to the syntax. Also, I found it rather difficult to find my way through the huge documentation looking for a specific thing. The result looks nice a slick, however it lacks the tooltips for the slices. I could have added them but that would have added to the already long piece of code I used to create this simple D3 pie chart.
How to create a pie chart with Google Charts
Google charts is a library developed by Google. It has a lot of chart types and if you ever used apps from Google like Google Analytics you already saw it in action since thats how the dashboard is created. As D3 it also uses SVG to create charts.
Here is the link to download & install Google Charts and the Google Charts documentation and examples.
Reasons to use Google Charts for creating charts – Google Charts Pros
- it’s free to download and use as you want and this library is licensed under the Creative Commons Attribution 3.0 License
- Google Charts offers a wide variety of out-of-the-box charts (I would say almost all charts you can think of)
- allows loading chart modules selectively, so less heavy weight than D3, but still…
- it is very well documented and examples are provided
- chart animation is possible
Reasons to not use Google Charts for creating charts- Google Charts Cons
- relatively complicated method for initializing the charts
- Google Charts requires some advanced JavaScript techniques when trying to use multiple charts in the page that are initialized at different moments
- Google Charts requires that data passed to the charts to be prepared in advance via Google Charts internal structures
- It uses SVG for rendering charts which can slow down the browser
- requires advanced JavaScript knowledge to use
- charts are not responsive
Conclusion about making a Google Charts pie chart: The initialization of the chart and the preparation of data was a bit of trial and error until I got the hang of it. Documentation is good and it’s very nice that there are a lot of customizations that you can add to a chart. All-in-all a good impression.
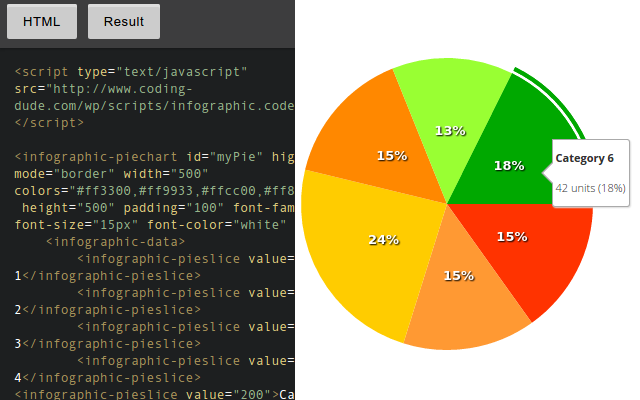
How to create a pie chart with Infographic Charts and Graphs Tag library
The Infographic tags chart library is a very light weight JavaScript chart library. It uses custom HTML tags to define the charts and it uses HTML5 canvas to render them.
Here is the link to download & install Infographic Charts and Graphs Tag library and the Infographic Charts and Graphs Tag library documentation and examples.
Reasons to use Infographic Charts and Graphs Tag library for creating charts – Pros
- it’s very light weight
- does not require JavaScript or programming skills to use; it’s a tag library so just copy/paste in HTML code
- easy to use and has a lot of different out-of-the-box charts
- customization of the charts is made by changing HTML element attributes
- Infographic Charts and Graphs Tag library offers responsive charts
- it is very well documented and examples are provided
- it uses HTML5 canvas which is fast and reliable; also easily allows saving charts as PNG images
- has tooltips
Reasons to not use Infographic Charts and Graphs Tag library for creating charts – Cons
- has a long name 🙂
- is strictly focused on charts creation
- charts are not animated
Conclusion about makinga Infographic Charts and Graphs Tag library pie chart: I honestly prefer this library over the others for creating straight forwards charts. I was just a matter of making a reference to the JavaScript file and pasting 8 lines of HTML code and the pie chart was there. So, using this library took the least amount of work, and as you can see the results are better than D3 and identical to Google Charts.
One last remark I want to make about this library is that it also has an extension built on top of it for WordPress. It’s called Charts and graphs WordPress Visual Designer and it allows visually setting up a chart right in your blog posts. This is exactly what I used for the pie chart below.

Hope you enjoyed this post about making a simple pie chart. All these are client side libraries, so they run inside the client browser. If you are interested how to hook charts to data taken from the database, here’s a nice post about making a pie chart with PHP and MySQL.

Hello..
“Infographic Charts and Graphs Tag library pie chart” is it free to use ??
in the provided download link it is asking to pay..
Hi,
it’s not free, but it doesn’t cost that much
[…] If you are interested in drawing with JavaScript you should definitely check out this simple piechart example using JavaScript. […]
[…] choice. If you don’t know how various charts libraries work you should take a look at these simple examples for how to create pie charts with 3 different libraries. […]