The Infographic Charts and Graph Tags library developed by coding-dude.com (hey, that’s me) kicked as quite a success. I’ve received very positive feedback from the users and also a few very interesting feature requests. Therefore I decided to include these feature requests and release it as version 1.0.1. This version has just been submitted and can be downloaded here.
In this post I would like to show to you some of the new features added to version 1.0.1.
Piechart and doughnut changes
- added the “label-type” attribute to piechart/doughtnut which allows representing either percentage (“percent”), value (“value”) or hiding the slice label
- added the “label-decimals” attribute to piechart/doughnut for indicating the precision of the number displayed on each slice
- added the “label-unit” attribute to piechart/doughnut for indicating the name of the measure unit used on each slice (eg. millions, billions, pcs, etc.)
- added the “hole-size” attribute for doughnut charts to indicate the size of the center hole
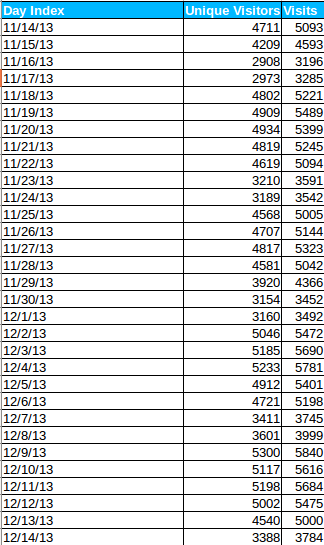
Line graph with CSV support
Added support for displaying CSV data for the line graph (eg. you can export CSV data from GoogleAnalytics and use that file as a parameter for the graph and it will display it accordingly). The following line graph is using a CSV export from Google Analytics you can see the file here.
Visits vs. Unique Visitors Line Chart (CSV Source)
Line graph and bar chart graph support for negative values
Line graph and bar graph has been adjusted to also support displaying of negative values.
Temperature Avg. Line Chart
Shape graph with radial fill
Shape graph now supports extra type “radial” which creates radial fill for the shape
So, don’t forget, if you want to download this infographic library


plz send me .zip link of this temp
You can get the library from here: http://codecanyon.net/item/infographic-charts-and-graphics-html-tags-library/6351274?ref=psddude it’s only 14$
I can use this with access database, sql database, csv or any other datasource?
Thanks
Yes you can, and the infographic library has native support for CSV without needing a server side component.
John – Looking to make a graph along the lines on this page . I don’t think the package on Code Canyon will be enough. Perhaps I can hire you to build something like it (needs to run on a WP site). Let me know – thanks.
sure, this is possible using the WordPress plugin for charts and graphs
I’m using Infographic library. Using a bar graph. The scale numbers on the left of the grid are 1/2 covered by the first bar in the bar graph. How can I fix this?
Second question:
Is it possible to make the graph elements (bars, pie slices, etc.) clickable? I would like to display a detail page when an element is clicked.
Thanks for your help.