This section contains the various projects that I’m developing. Some of them will be commercial and some of them will be free.
Infographic Charts and Graphics HTML Tags Library
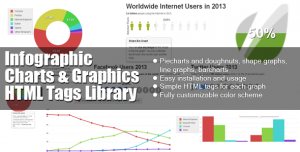
This custom JS charting library created by PSDDude from 0 implements custom HTML tags which allow creating charts and graphs for infographics.
It is a light-weight, pure JavaScript charting library (NO jQuery or other libraries required) which makes use of HTML5 technologies and works on all modern browsers including IE, Chrome, Firefox, Opera, Safari.
To use it you do not need to know any JavaScript, as all the charts are added as HTML tags. You can follow the very straight forward documentation which also contains examples.
The library allows creating: – Piecharts and doughnuts – Shape graphs – you can transform any image(PNG) into a graph – Shape bar graphs – use any image (PNG) to construct a bar chart – Line graphs – Barchart graphs
Extensive easy to use documentation included.
Easy customization: color scheme, size, etc.


making a disney animated movie