In this tutorial I will show you how to draw a line pattern using JavaScript and the HTML5 canvas. Drawing with HTML5 canvas is not too difficult and it only requires some basic HTML and JavaScript knowledge. At the end of this tutorial you know how to do simple drawing using HTML5 canvas and JavaScript and how...
Tag: charts
Pros and Cons for Creating Simple Pie Charts with 3 Popular JavaScript Chart Libraries
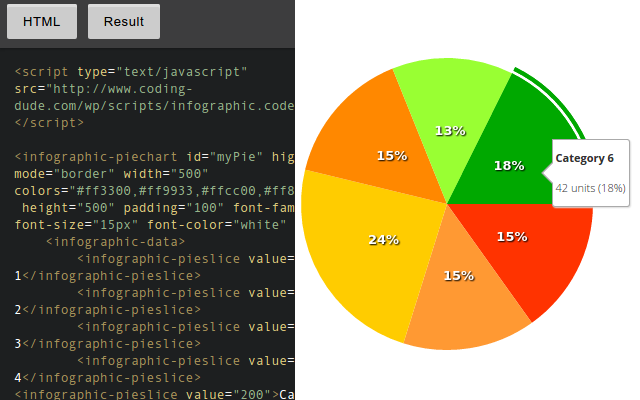
In this post I will discuss how to create a simple pie chart using 3 popular libraries: D3, Google charts and Infographic Charts library. I will be looking at the pros and cons for pie chart created with each library. We will try to use the libraries such that the end result looks as similar...
Creating a PHP MySQL pie graph
How To Generate A Pie Chart In PHP MySQL Using The Infographic HTML Tags Library In this short post I’m going to show you how you can create a pie graph using the Infographic JS HTML Library based on data taken from MySQL. Some of the users of the Infographic Library have been asking this...
Charts and Graph Tags Infographic Library v1.0.1 Preview
The Infographic Charts and Graph Tags library developed by coding-dude.com (hey, that’s me) kicked as quite a success. I’ve received very positive feedback from the users and also a few very interesting feature requests. Therefore I decided to include these feature requests and release it as version 1.0.1. This version has just been submitted and...


