The Infographic Shortcodes WordPress plugin is free to download and can be downloaded here.
Infographic Shortcodes WordPress plugin
Installation guide
In order to use infographics like pie charts and doughnut charts, bar charts, line graphs and all the other graphs offered by the Infographic HTML Tags Library you will need to follow these steps:
- Download the Infographic HTML Tags Library
- From the package take the src/infographic.min.js file and upload it on your WordPress server (for ex. in a folder called scripts so the link to the script might look like //www.example.com/scripts/infographic.min.js)
- Download the Infographic Shortcodes WordPress plugin zip file
- Install the plugin in your WordPress by going in your WordPress administration console in Plugins > Add new > Upload and upload the plugin zip file
- Configure the plugin by going in your WordPress administration console in Settings > Infographic Shortcodes and in the “Infographic Library URL” fill in the URL of the Infographic Library (eg. //www.example.com/scripts/infographic.min.js)
That’s it! If everything is configured properly you can start using the Infographic Shortcodes WordPress Plugin.
How to make an infographic using the Infographic Shortcodes WordPress Plugin
You can use the Infographic Shortcodes WordPress plugins in 2 ways:
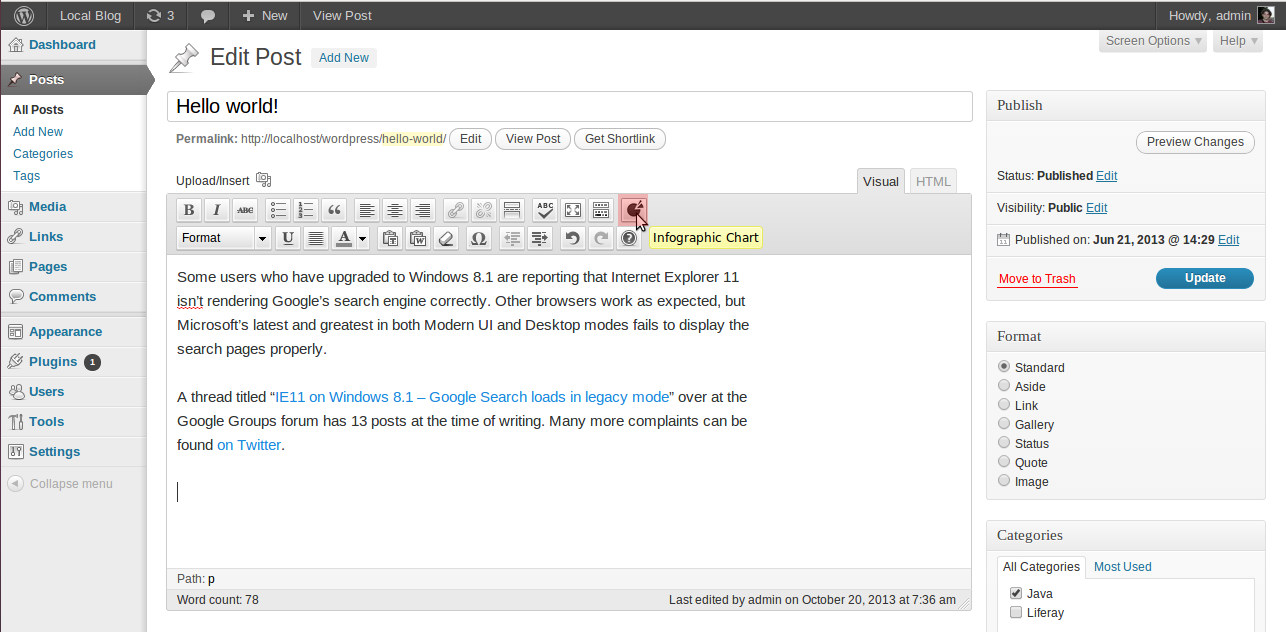
1. Using the Infographic wizard button ![]() . This button appears in the rich text editor menu when you create/edit a post or page. This button is also context aware, so you will be able to edit charts that you created earlier.
. This button appears in the rich text editor menu when you create/edit a post or page. This button is also context aware, so you will be able to edit charts that you created earlier.
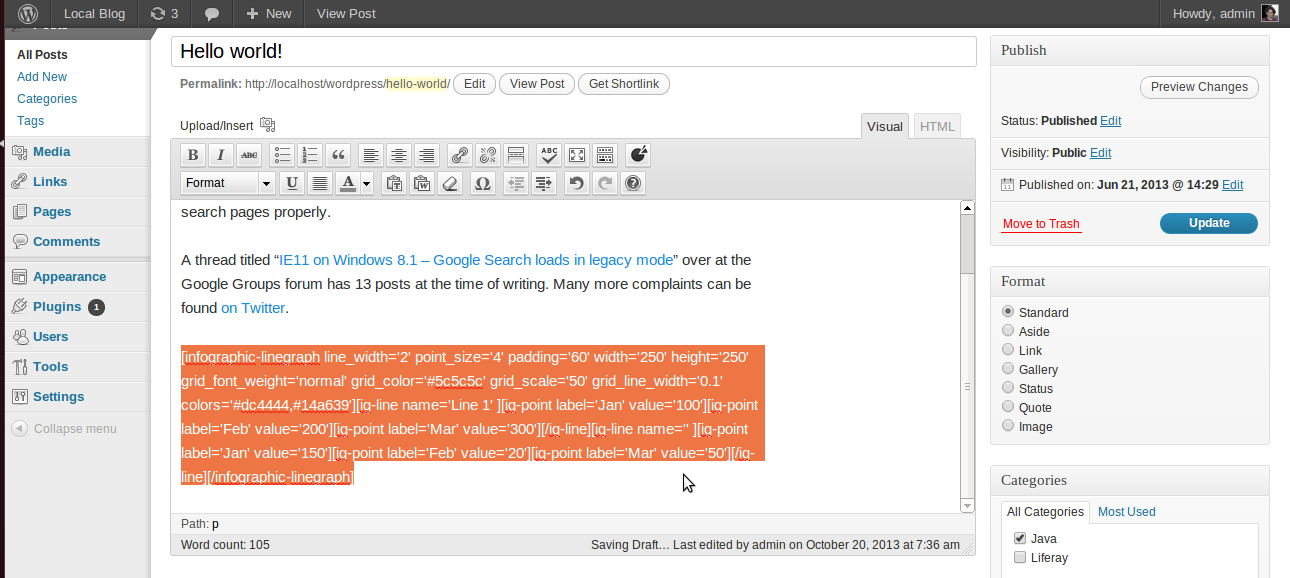
2. By keying in the shortcodes corresponding to the graph / chart that you want to display. Each shortcode has a series of parameters. The available shortcodes are:
[infographic-piechart]
[infographic-shapebargraph]
[infographic-shapegraph]
[infographic-linegraph]
[infographic-bargraph]


Interactive infographic examples
Example bar chart made using the infographic WordPress plugin. Here is the source code:
[infographic-bargraph bar_type='normal' width='450' height='250' colors='#044d6f,#3c83ba,#19a4db']
 [ig-bargroup name='Infographic Example Dataset 1' ]
  [ig-bar label='Subset 1' value='100']
  [ig-bar label='Subset 2' value='200']
  [ig-bar label='Subset 3' value='120']
 [/ig-bargroup]
 [ig-bargroup name='Infographic Example Dataset 1' ]
  [ig-bar label='Subset 1' value='50']
  [ig-bar label='Subset 2' value='75']
  [ig-bar label='Subset 3' value='88']
 [/ig-bargroup]
[/infographic-bargraph]
For any of the interactive infographic charts produced you can right click on them and save them as PNG images. The result will look something like this:

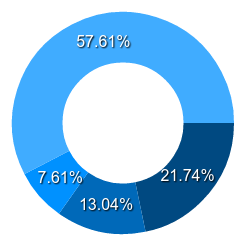
Here’s another example, a pie chart infographics:
[infographic-piechart type='doughnut' padding='10' highlight_mode='border' font_family='arial' font_weight='normal' width='250' height='250' colors='#004981,#0069b9,#0091ff,#40acff,#91d0ff']
[ig-pieslice label='Pie chart data set 1' value='20']
[ig-pieslice label='Pie chart data set 2' value='12']
[ig-pieslice label='Pie chart data set 3' value='7']
[ig-pieslice label='Pie chart data set 4' value='53']
[/infographic-piechart]
I’ve also exported the image for this infographics and the result looks like this:
If you want to see what and how to create infographics you can get inspiration from a few infographic examples that I have made using the HTML Infographic Library. The sample infographics features are all supported by the Infographic Shortcodes WordPress Plugin.
This is the best chart and graph WordPress plugin that I have tried so far. Very friendly interface, flexible and so easy to use! Thank you 🙂
Thanks Gary! You are the first user of this plugin I think, feedback is very valuable for me
just installed it and works perfectly! thanks man
The best tool for creating charts and graphs! thanks a lot
Can I use this plugin to display dynamic data? I need to get the data from an ftp site and convert it before display. Any idea?
Thanks. Elizabeth
Hi,
please check the “data-csv” attribute in the documentation
[…] WordPress plugin […]