WordPress charts and graphs plugin – visual designer for charts and graphs right into your posts and pages.
This plugin allows you to easily add and integrate charts and graphs into your posts and pages. Very intuitive UI and lots of configuration options for creating:
- stunning pie charts and doughnut charts
- bar charts
- line charts
- image charts
- image bar charts (with these 2 last charts you can use your own PNG images as shapes to create your charts).
Ideal for statistical graphs, poll results and infographics.
For details on how to use the Charts and Graphs WordPress Visual Designer please download the Documentation,
Pie charts and doughnut charts
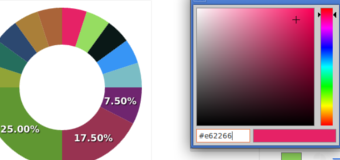
Simple pie chart with color highlight mode and default color palette. |
|
|
Bar charts
Vertical bar chart with default color palette. | Horizontal bar chart with custom color palette and no grid. | Horizontal stacked bar chart with custom color palette. |
Line charts
Line chart with single thick line. | Line chart with multiple lines and custom colors. |
Image charts
Vertical image chart with Envato logo and custom colors. | Radial image chart with WordPress logo. | Horizontal image chart with battery icon. |
Image bar charts
5 main chart types with variations
You can mix and match various settings for the charts giving you exactly what you need for graphical data representation.
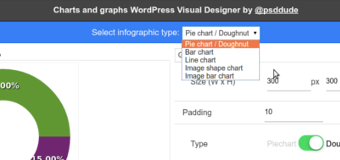
Visual designer for charts&graphs
You design your charts and graphs inside the posts/page editor. You see immediately how the chart will look in a live preview embedded in the visual designer


