Online marketing is essential to getting your products out there. In this post we will take a look at Facebook ads performance or more specifically the lack thereof. I decided to run a test campaign via Facebook ads and after seeing the results I thought it would be a good idea to share the results.
I believe it’s important that when you want to promote your website or products via online marketing campaigns you need to know what to expect regarding the campaign efficiency. Sometimes this is not possible due to the lack of data. If people would share their experience with various advertising platforms I think that the overall efficiency of online marketing would benefit.
What are Facebook ads?
Leading social networks worldwide as of April 2016 – made with WordPress chart designer
Facebook is by far the most popular social media network to date. This means that it has an enormous number of active users, with almost 1.6 billion active users ranking it no. 1 as you can also see in the chart.
This gives Facebook a huge potential as a platform for distributing ads. And that’s what Facebook did. The Facebook ads service shows targeted ads in News Feed on desktop, News Feed on mobile, and in the right column of Facebook on desktop.
What does targeted mean? It means that Facebook allows you to place ads for specific categories of users. This categories include gender, age, location and even interests. Ad targeting is essential for running efficient marketing campaign. You would probably want your campaign for women’s makeup for example to display ads for women and not for men.
Facebook ads are relatively easy to setup, in fact Facebook almost annoyingly pushes them on you by proposing to “boost your post”. They don’t have the most intuitive interface for defining the ad, but let’s just say it works.
I don’t want to go into more details here because the purpose of this post is to discuss Facebook ads performance, which is exactly what we’ll do in the next sections.
Facebook ads performance vs. costs
You can argue left and right about ads, but in the end the performance of an add or its effectiveness is measured by the return you get on the cost invested. So, how much money you make by selling a product via an ad compared to the amount of money spent for running the ad campaign. This is sometimes difficult to calculate because sales might not go right away, there are also products sold in combination with the product advertised, there are products that are returned, etc.
That’s why there’s also another way to measure the performance of ads. That is the number of times the user clicks on the ad. This is usually referred to as conversion rate calculated as the percentage of users that click on the ad from the total number of users that see the ad.
Conversion rate is a good indicator of user’s interest in your product.
The ad campaign
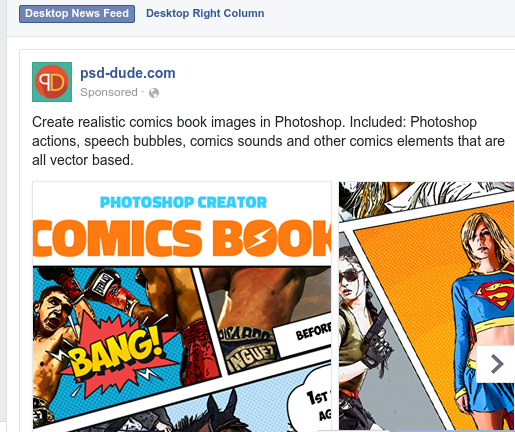
What I did was run 2 Facebook ad campaign for a couple of my products:
I wanted to see if I get any sales out of promoting them via Facebook. I know for a fact that they are interesting products and people are buying them, so it was just a question to see if Facebook users would also buy it.
I have set similar campaigns targeting males between 25-34 in Brazil. The reasons for that specific demographics was that looking at my sales data that’s the best conversion rate segment.
Just to give you an idea, The average conversion rate in general is between 1.5-2%. For all my products it’s something like 1.6%, and for the segment selected I have a 3.6% conversion rate.
With my hopes relatively high I kicked of the campaign and waited.
The total spending was $78.64
and the result for that was
So, let’s interpret this a bit. The website clicks row refers to the Cartoon and Comic Book Photoshop Styles product. There were 32,360 impressions of the ad and 168 clicks.
For the WordPress charts visual designer plugin there was a total of 957 impressions and 147 engagements – translated to about 125 post likes and the rest I assume were clicks.
0.5% Click through rateCartoon and Comic Book Photoshop Styles | 15.3% Click through rateWordPress charts visual designer plugin |
One thing to note here is that the 15.3% click through rate is abnormally high. Also, digging further in my data I found out to my surprise that the number of visits on the page of the WordPress visual designer plugin coming from Facebook was actually only 2. Not 2 percent, but 2 actual users. I won’t lie, I was very disappointed.
How about the other product? It turns out that from the 168 clicks I could only identify 45 users landing on the product page and from those there was not even one single purchase.
Facebook ads performance conclusion
Well, I don’t know how to put it mildly, but I just feel that I’ve been had for 78.46$ by Facebook. Facts are that the return on my ad costs was 0$ and it feels to me that the 125 likes I got are fake. I’m not saying that Facebook is running a scheme here, but for sure they have to do more with identifying fake accounts and fake engagements. Until then I don’t recommend wasting money with Facebook ads. I know it’s tempting, but don’t do it.
I don’t want to name names with alternative networks here, because this is not that kind of a post, but please trust me that the most efficient marketing campaigns I have run where via newsletters – with an average open rate of 20% and a conversion rate of over 3%.
And to get people to register for your newsletter you have to write about interesting stuff like this post. By the way, if you want to register for the Coding Dude news letter you can do so here


Thank you, John, for sharing your online experience with targeted Facebook ads.
I see that a week after you wrote this, the Wall Street Journal announced “P&G the world’s largest advertiser scales back on targeted Facebook ads.”
Coincidence?
Hi David, thank you for pointing that out. I think it’s rather unfortunate that I’m not the only one that was let down by Facebook ads